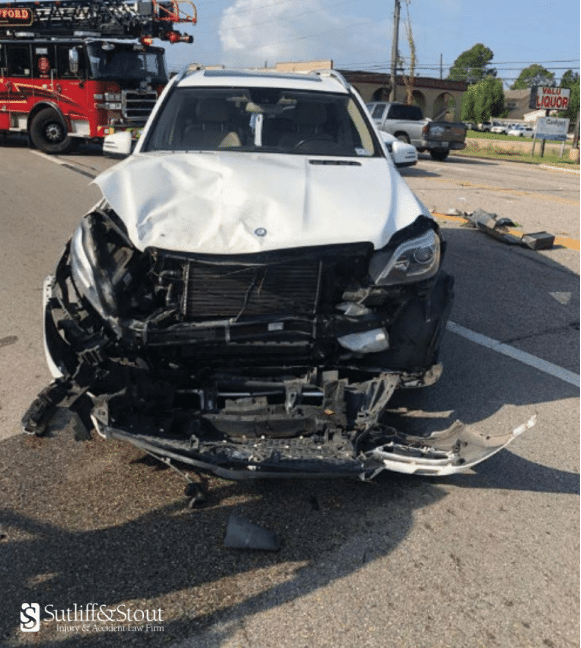
Hotspots Map of Accidents Near Houston Area Schools

100% Free Consultation

No fees unless you win. Contact us today. Get Started

Every parent wants to keep their child safe, no matter where they are or where they are going. Typically, school zones are a place of safety and security in relation to car traffic, but this is not always the case. From 2013 to 2018, Houston had 319 vehicle crashes in active school zone flagged areas. The map below will show where each of the crashes occurred depending on the filters included in the Map Features to the right. The Map Features include:

  • School Ranges: See where schools are located on the map, including pre-kindergarten, kindergarten, elementary, middle school, and high school.
  • Crash Severity: Allows you to see crashes based on the severity.
  • Year of Crash: View the crashes in a chosen year.
  • Day of Crash: See the crashes that occurred on a chosen day.
  • Time of Crash: Allows you to see crashes that happened during specified hours. The time is listed in military time (i.e. 2pm is 14:00).

You can use multiple filters to explore the data. For example, you can see crashes that occurred near an elementary school that resulted in a possible injury in 2013 on a Monday at 7 in the morning and 12 in the afternoon. The legend below the Crash Features shows how each filter is displayed on the map and the data table shows the map’s filtered data results.

We found this data through the Texas Peace Officer’s Crash Reports query tool with all reportable data processed by the Texas Department of Transportation.

Houston Crash Data By Time

From the data set, we were able to see the year, day, and time of each crash in an active school zone. We have analyzed the data to find when the most crashes occurred during specific parameters.

Year with the Most Crashes:

  • 2017: The year with the highest amount of crashes was 2017 with 27% of the crashes. The year 2018 has the lowest amount of crashes so far with 8.2%. The percentage of crashes in active school zones increased from 2013 to 2015, and then dropped in 2016 before hitting the highest percentage of crashes last year.

Day with the Most Crashes:

  • Wednesday: Surprisingly, Wednesday had the highest percentage with 24.5% of crashes. Unsurprisingly, the weekend had the lowest percentage with 7.8% of crashes.

Time of Day with the Most Crashes:

  • Afternoon: When looking at the time of day the crash occurred, neither the morning nor the afternoon had an overwhelming majority; the morning held 48.9% of crashes and the afternoon came out on top at 52.1% of crashes.

Houston Crash Data by Person & Place

Included in the data set was the number of persons involved in the crash, the age of each person, and whether the crash was related to an intersection.
Amount of People Involved in Crash:

  • Two vs. Ninety-Two: The majority of crashes only involved two people. There was one crash on a Wednesday in 2014 that involved 92 people. It was not intersection related and did not result in injuries.

Ages Involved in Crash:

  • Eight Years-Old: In the crash stated above, the youngest person affected was five years old while the oldest person was 69 years old. In the 319 recorded crashes, the most common age that was affected by school zone crashes was eight years-old. The oldest age that was affected was 97 and the youngest was less than a year old.

Fortunately, 69.3% of crashes did not result in injury and only 10% resulted in injury. The 10% includes the number of crashes that resulted in non-incapacitating injuries and incapacitating injuries. Out of the 319 crashes, only 1.9% had incapacitating injuries. Children are the top priority for parents and schools. Keeping them safe in a school zone is essential to both parties.

*All crash data represents reportable data collected from Texas Peace Officer’s Crash Reports (CR-3) received and processed by the Texas Department of Transportation (Department) as of 06/14/2018. The Department makes no warranty, representation or guaranty as to the content, accuracy, timeliness or completeness of any of the information provided. Any opinions and conclusions resulting from analysis performed on the crash data must be is presented as our own and not those of the State of Texas or the Department.

Get a Free Case Review

    Our Office Locations

    Houston Office (713) 405-1263 550 Post Oak Blvd, Suite 530 Houston, TX 77027
    Austin Office (512) 616-2222 9433 Bee Cave Road Building III, Suite 200 Austin, TX 78733
    Marble Falls Office (830) 201-1111 705 US 281, Suite 200 Marble Falls, TX 78654
    San Angelo Office (325) 340-4000 202 W Beauregard Ave San Angelo, TX 76903